
The hidden leaders in renewable energy: a closer look at global superpowers
The threat of global warming is undeniable, yet the actions of the world’s superpowers to combat this crisis are often misinterpreted. Instead of being shown accurate and understandable metrics, we are given massive figures that lead us to the wrong conclusions. When comparing the renewable energy production of companies we almost always look at total renewable energy production. While countries should strive to increase their total energy production, drawing comparisons of this metric is inaccurate as it does not account for population size, meaning larger countries naturally produce and consume more energy, skewing comparisons against smaller nations.
It is promising to see that these countries are generally producing more energy each year, and this increase appears to even be exponential for some.
Through delving into the ‘Statistical Review of World Energy’, this article reveals which of the top ten economies—USA, China, Japan, Germany, India, UK, France, Russia, Canada, and Italy—are leading in total renewable energy production. I will then propose an alternative metric that may reveal the true climate heroes. Before we begin, it is vital to introduce one key word of terminology – terawatt hours. Terawatt hours are units that represent the amount of energy produced. For reference, one terawatt hour is enough to light approximately one million houses for a whole year!
Total Renewable Energy Produced per Country
Using the data within the ‘Statistical Review of World Energy’, we can plot the total amount of renewable energy each country has produced from 1995 to 2023.
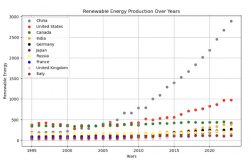
From this plot, it is clear that China leads the race by far, producing the most amount of renewable energy. They are then followed by the USA, Canada, India, Germany, and the rest (in that order). It is promising to see that these countries are generally producing more energy each year, and this increase appears to even be exponential for some.
This is the data we are most commonly presented with when researching which countries contribute the most to renewable energy production. However, the question of whether this is a good measurement is rarely asked. Sure, China is producing the most renewable energy, but they are also the largest producer of carbon dioxide seeing as their population and manufacturing industry is so large. It therefore does not make sense to compare countries with this metric alone without taking into account their consumption of energy.
For each person, Canada produced over 0.01 terawatt hours of energy, enough to power 10,000 houses for an entire year.
One, perhaps more useful, metric is renewable energy per capita. It represents the amount of renewable energy produced per person in a country and can be calculated by dividing a country’s total renewable energy production by the population size. Although this metric still does not explicitly take a country’s fossil fuel consumption into account, generally countries with larger populations consume more energy. Thus, by contextualising countries’ renewable energy production relative to their population size, we can paint a more accurate picture of the climate leaders.
Renewable Energy Per-Capita
By sourcing data from the UN Records, the CIA, and the World Data Bank, we are able to find good estimates for the population size of the aforementioned countries from 1995 – 2023. We can start by just focusing on 2023. Plotting this per-capita as a bar graph we get the image below.
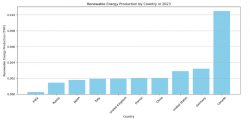
Clearly, with this graph, we can see now that Canada is leaps and bounds above the rest! For each person, Canada produced over 0.01 terawatt hours of energy, enough to power 10,000 houses for an entire year. This is impressive considering the next closest country, Germany, barely managed 0.003 terawatt-hours. Of course, it would also be interesting to see the rate at which countries are increasing their renewable energy per capita each year. This can be seen plotted on the graph below.
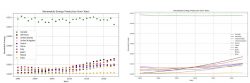
With this graph, it is visible that while Canada is doing better than the rest, they are not particularly improving over time. In fact, in 2023, their renewable energy per capita was their worst yet. While the other countries trail behind Canada, most are improving year after year. This is a promising sign as it means that, even while the population in many of these countries are increasing, they are still continuously producing more and more renewable energy per person.
Gaining a sense of the full picture can allow us to stay grounded in the reality of how countries are improving or falling behind.
The future of renewable energy
Lastly, we can use these trends to predict which countries will be leading renewable energy production in the future. Obviously, this is quite a guessing game as there are so many factors involved, but based on current data examined alone, the 2050 predictions look quite like the image below.
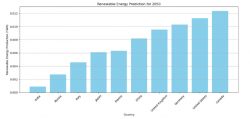
Here, we can see that if Canada’s lack of improvement in renewable energy per capita continues, Germany and the United States will have almost caught up to them by 2050. In the meantime, most countries will have almost tripled their renewable energy per capita.
Examining renewable energy production from 1995 to 2023 under different statistical lenses reveals an encouraging trend: an exponential increase in renewable energy output in most countries. While China still leads in total renewable energy production, introducing the metric of renewable of energy per capita can help us gain a more accurate perspective on each country’s contribution to combating climate change. Canada, a perhaps more secret superpower, significantly outperforms the other nations, producing over 0.01 terawatt-hours per person. That being said, while Canada’s renewable energy per capita production is impressive, it lacks in improvement over time. The other countries showcase steady yearly increases in renewable energy per capita, indicating a positive trend towards a more sustainable global energy market overall.
This analysis underscores the complexity of evaluating global efforts to combat climate change. Total renewable energy production is an important number that countries should aim to increase, however, for the purpose of comparison, it must be contextualised within other factors such as population size. The per capita measurement, albeit not perfect, achieves this to a better extent. Moving forward, it is important to consider the significance of climate statistics. In an era of global misinformation and flashy headlines, gaining a sense of the full picture can allow us to stay grounded in the reality of how countries are improving or falling behind in the race to produce more renewable energy.
Comments (1)
You are going places Sreyas. Pleased to see your research article getting global recognition. Way to go!